Following the Sun

As of Q3 2018, the solar industry has deployed a total of 60 GW of capacity across the United States, according to the Solar Energy Industry Association (SEIA). By now, solar PV is no longer seen as a risky investment, but a mature industry.
For years, much of the activity in solar deployment has been concentrated in just a few markets like California, Arizona or Massachusetts. Unsurprisingly, the markets that have shown the greatest growth over the past decade have also become highly competitive both in terms of the sheer number of active solar developers and installers, but also in terms of hosting capacity and the ability to interconnect new projects.
Given that the price of solar continues to fall, the question becomes: where should we watch for the solar market to move next? What are the sets of states that have the market potential to grow rapidly over the next five years?
Recently, our team took on the task of creating a model that would attempt to answer this question. This brief article will highlight our work over the past term, and instructions on how to use a modified public version of our research to model a representative project in your county.
Key takeaways: solar markets are expanding throughout the United States
One of our key findings is that there are several states that are poised for large solar growth based simply on an attractive and improving fundamental cost advantage over traditional energy generation and incumbent electric utility rates. These are states that are not traditionally associated with solar, such as New Hampshire, South Carolina and Alabama. Even with little or no policy support, our research shows that the commercial and residential solar sectors are poised to flourish in these markets based on solar’s cost advantage over grid power.
Our modeling also shows:
- High average utility rates make solar attractive even in states with a poor solar resource like New Hampshire
- Policy uncertainty in historically attractive states like New Jersey and Connecticut cloud future project viability
- Developers that can leverage equipment cost declines to build systems below the national average installation cost can enter new markets that have seen minimal solar deployment to date
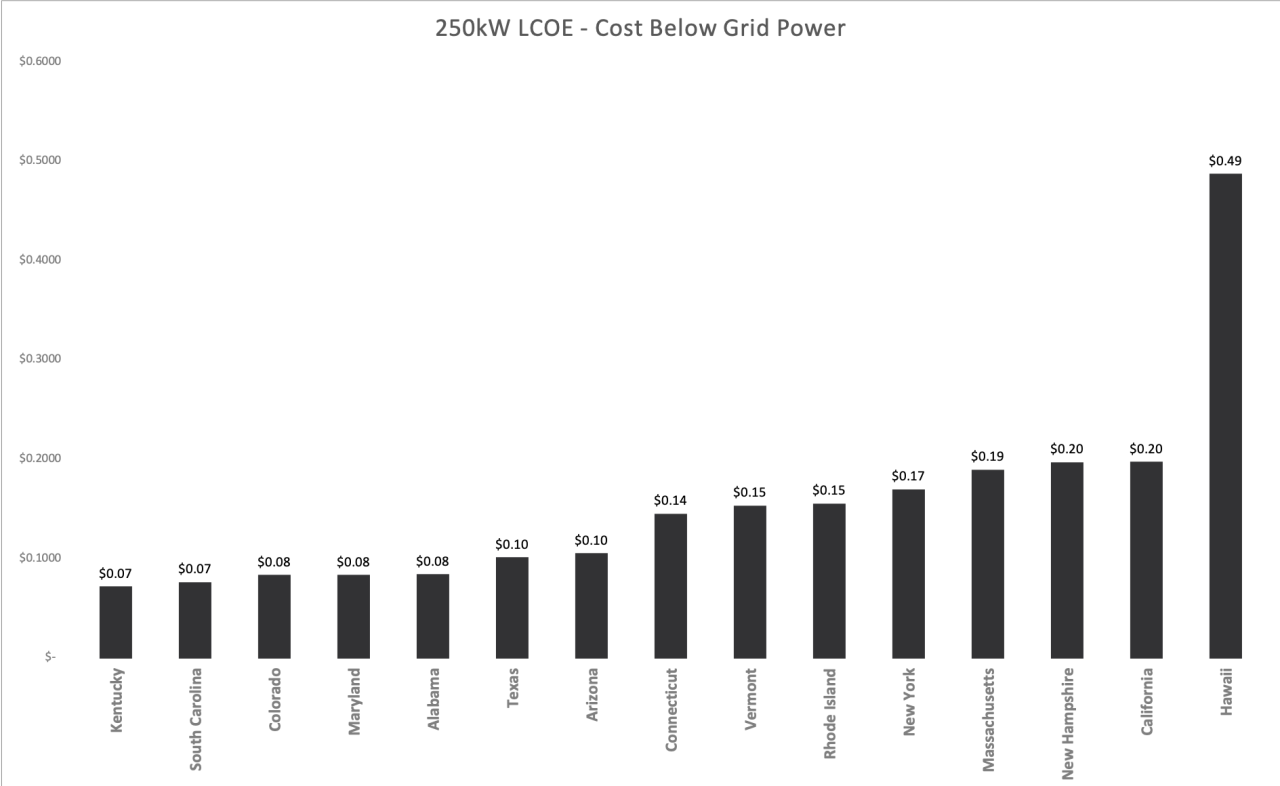
Today it is possible to construct commercial solar projects with a lifetime levelized cost of electricity that is significantly below the current retail electricity rate in a number of states. As solar costs continue to decline, we anticipate that solar will only become more attractive relative to incumbent utility rates.
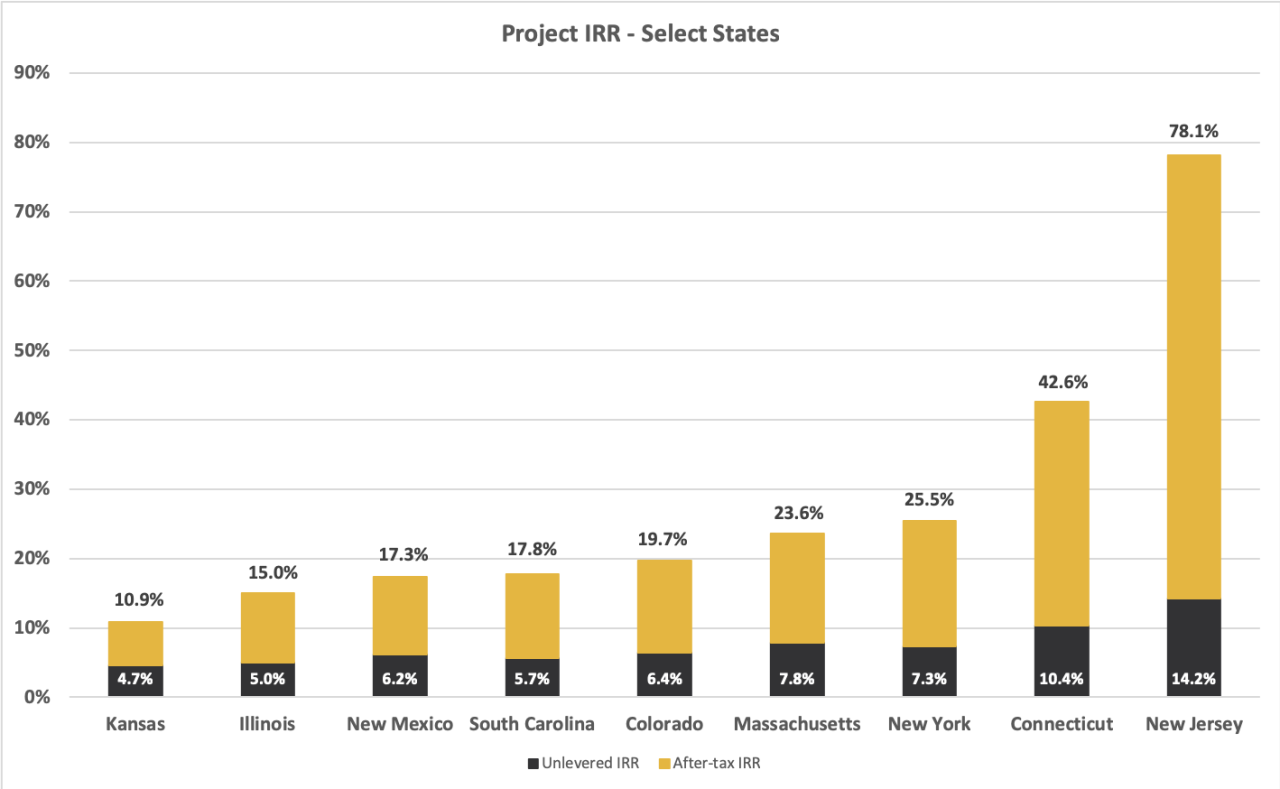
Our model also shows that there is potential for strong financial returns to solar developers in a number of states, including states with minimal development to date. Since our modeling approach used national-average installation cost assumptions, we believe low-cost developers could find lower competition and attractive returns in markets like Alabama, Maryland and Georgia.
Yale Team Used Public Data to Model Solar Projects Across States
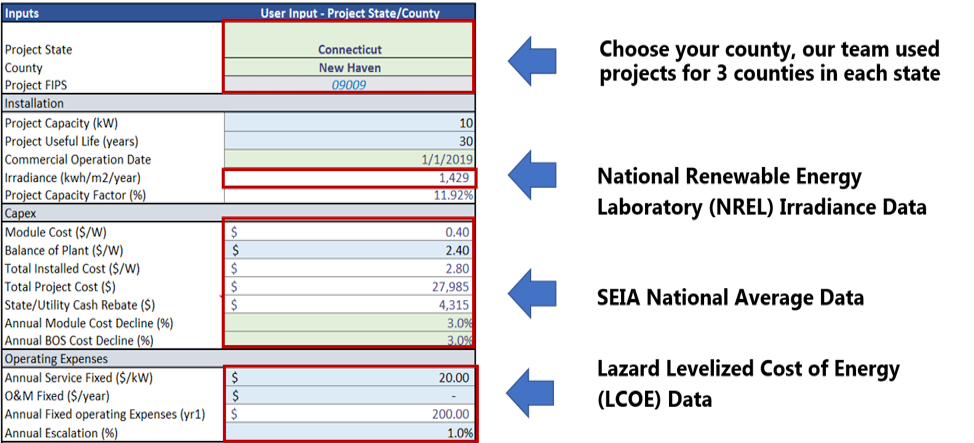
We looked at all fifty states across the United States, utilizing public data from the National Renewable Energy Lab (NREL), Solar Energy Industries Association (SEIA), and Energy Information Administration (EIA). By creating a financial model that inputs irradiance at the county level, national average costs, and state average retail rates - both residential and commercial - we developed a tool for users to analyze representative solar projects at a granular level. Figures 1 and 2 below detail the inputs to the model, which is included with this piece.

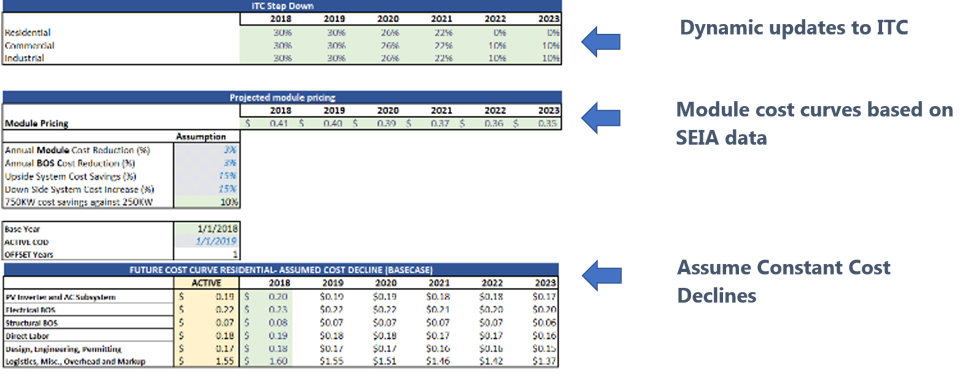
In addition to using county-, state-, and national-level data for analysis, our team took a sampling of counties from each state to include the effects of state and local taxes as well as incentive programs. Sources such as the Database of State Incentives for Renewable Energy (DSIRE) and NREL’s Midmarket Solar Policies were used to quantify policy incentives such as state rebates (e.g. New York State’s $5,000 solar tax credit) or utility incentives. In the states that have strong Renewable Energy Credits (RECs), we projected price curves using conservative assumptions to estimate the impact of REC pricing on project economics. Finally, the model allows the user to test the impact of the Investment Tax Credit (ITC) step down as well as projected declines in solar module and balance-of-system costs by dynamically adjusting the project’s expected commercial operation date (COD).
From the given inputs, the model calculates how representative projects of three sizes (10kW residential, 250kW commercial, and 750kW commercial) could potentially perform in a selected county across the United States. Different project sizes give insight into the different return profiles between residential and commercial installations -- and different electricity rates for residential projects versus commercial ones.
The model outputs include the project’s unlevered internal rate or return (IRR), a levered IRR, and the Levelized Cost of Energy (LCOE) for a project in each state. Our analysis compared these outputs across geographies, project sizes and commercial operations date.
Discussion
Though our findings offer representatives projects across the country, there are a few outstanding questions for discussion that the team thought about that will impact how solar policy looks move forward:
ITC Step Down - In every state the ITC step down will negatively impact project economics. In certain states with above-average installation costs, we believe the market may be able to absorb considerable installation cost declines, which will blunt the impact of the ITC step down. The step down will be more pronounced in states that have less room to reduce installation costs, and in markets with less supportive state policies and incentives.
State Policy Uncertainty - We modeled states like New Jersey and Connecticut under forms of their current solar policy. However, both are undergoing major changes that will impact the next decade of solar development in their states. How might these new policies impact project fundamentals? Similarly, states like New Mexico are already strong with minimal policy investment. Might new changes by a new administration “super-charge” that state?
Installation Costs Vary by State - Labor, material and financing costs vary across the country. However, our analysis used nationally-representative installation costs to model projects across states. While holding this variable constant across states allowed our team to better understand the impact of irradiance, taxes and incentive differences between states, it inherently misstates the very real installation cost variance between markets.
Limitations
It is important to highlight some key caveats around these outputs. For one, we assumed that all solar energy would be used on-site, so net metering was not taken into effect. We also did not include other incentives that could make these projects even more attractive (i.e. some states like New York and Massachusetts have an added value of solar depending on if its paired with storage or based on a location). In addition, we projected REC curves, that while conservative may not accurately reflect REC prices moving forward. Our analysis represents a comparative snapshot between the states as of the start of 2019, but a number of states are currently updating their solar compensation rates and net metering policies. Finally, we did not have irradiance data for Alaska, so we were not able to account for projects in that state.
Future solar growth
Still, our findings suggest that there are many states like South Carolina, New Mexico, Colorado, Illinois, Kansas, New York, New Hampshire and Rhode Island that could host strong solar markets in the years ahead.
Continuous cost declines in panels and balance of system components have drastically improved the economics of residential and commercial solar projects. Given the high retail electricity rates in some regions and the excellent solar resource in other regions, states across the county are on the cusp--even without subsidies--of seeing significant commercial and residential solar market growth.
An introduction to using this model
This model was originally designed for an extensive analysis of solar project economics in each state across the country. A simplified version has been made available in the resources section below.
The user may run the model for every county in the United States, and across a range of scenarios. Inputs may also be updated by the user to model novel scenarios. User Inputs are highlighted with green shading on the operating tab, and key user inputs are also called out with a note. In particular, selecting a state and county in the drop-down cells C3 and C4 will update numerous inputs throughout the model including irradiance, taxes, electricity rates, and incentives.
Additionally, nine scenarios are available for selection. These nine scenarios model three different sizes of solar projects (10kW, 250kW, and 750 kW) across base, upside and downside input sensitivities. The user may elect to model a unique project size by overriding the project capacity input (Cell C7).
The model outputs include the unlevered and after-tax IRR for the solar project, as well the levelized cost of energy (LCOE). The study also presented a target Balance of System value that represented the maximum solar project cost (per watt installed) that could be maintained while delivering an LCOE at 10% below grid power. The user may replicate this analysis using the goal seek function.